The Interaction-To-Next-Paint (INP) is a key metric for measuring the interactivity of our web shop. A low INP is crucial for the usability of our application. All teams are responsible to monitor and optimize the INP of their pages and components.
The INP measures how much time delays between a user input (e.g a click), and the next UI update by the browser. This delay consists of three components:
- Input Delay: waiting for background tasks on the page that prevents from processing the interaction
- Processing Time: processing the tasks (= event handlers) related to the interaction
- Presentation Delay: handling other queued up interactions, recalculating the page layout, and painting page content
INP measures the time from when a user interacts with the mouse, touch, or keyboard until the browser has the first opportunity to present any feedback, which may include no feedback at all. This diagram illustrates a timeline of various tasks that contribute to the Interaction to Next Paint (INP) activity.
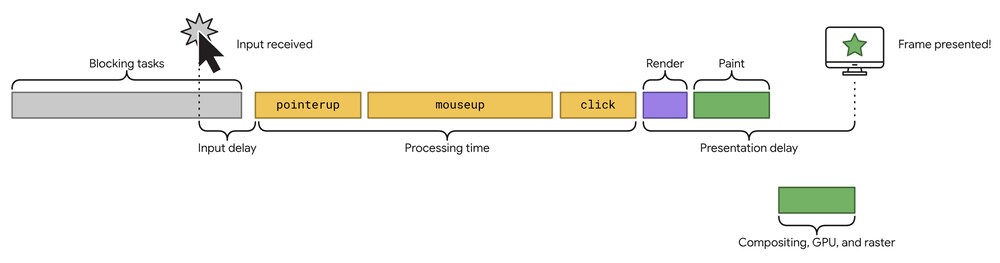
Image source: web.dev
#Why is the INP important?
The INP measures how quickly a page responds to user input, thus how interactive our shop is. This is important for usability because a lack of responsiveness is frustrating to users. A low INP means the page is responsive, while a high INP means the page is slow to respond.
INP 100 ms
Blocking the browsers main thread
The main thread is blocked,
when the cube stops rotating.
INP 1100 ms
Blocking the browsers main thread
The main thread is blocked,
when the cube stops rotating.
Additionally to the user experience, INP is also a ranking factor for Google's search results as part of the core web vitals. This means when two search results offer the same information, Google will display the faster result first.
#When to optimize?
If the 75th percentile measurement of your page is above the target performance you have to improve the interactivity of your page or instruct component owners to improve their components.
Do
The INP should be below 100ms, which is the threshold for human percievable lag
Don't
The INP must not be above 200ms, else we there will be an impact on SEO ranking.
If a component frequently records poor INP event, they are considered as technical debt and need to be improved. Teams have to follow our measurements, since they have higher accuracy and more real-time relevance compared to Google CrUX measurements. Team Helix will observe Google CrUX (=> SEO) performance on a monthly basis as a backstop.
#Identify slow interactions from real users
To find out what is causing a poor INP on a page, we look at real user data. This data tells us which component is contributing the most to the poor INP measurement. The INP takes into account both frequently used interactions that are not good enough and less frequently used interactions that are very bad. To help teams prioritize which components and interactions to improve, we provide a priority list.
#Experience slow interactions yourself
Once you have identified which components are responsible for the poor performance, it helps to try yourself, to get a feeling the interaction. Navigate to the page and play around with the interaction in different states or scenarios. To refine your testing your can check the meta information in the real user monitoring, for example for device type. To further help testing here are two chrome extensions:
Web Vitals Chrome Extension
The web vitals chrome extension shows the INP values in a heads-up display (HUD) and can also log the INP measurement (or any web vitals measurement) to the console for further analysis.
Web Vitals Extension in Chrome Web Store
Slow Mode Chrome Extension
The slow mode extension drastically slows down your browser while browsing on Galaxus or Digitec. It helps simulate slow devices and networks, making it easier to identify slow interactions. This is useful for understanding how your website performs in less ideal conditions.
From here on we will dive into technical detail. Some technical & browser knowledge is required
#Profile slow interactions locally
To identify the cause of the slow interactions it helps use profiling. Profiling will help you to identify which step after the interaction leads to a slow response. Below you find two different profilers that help identify the cause. When responding to an interaction there are three steps that happen in the browser before the next paint occurs. Each of those 3 steps can lead to poor performance and are tasks you can observe with profiling.
- Javascript on the interaction event handlers is executed
- React renders the changes as the result of the interaction
- Style changes are applied by the browser (CSS)
Chrome Performance Profiler To identify the root cause of a slow interaction, it is helpful to be able to reproduce it on your own machine or a test setup. You can use the performance profiler in Chrome DevTools to identify slow interactions locally (=lab). The performance profiler collects information about all the processes running in the browser, giving you insights into what is causing the slow experience. You can learn more about how to use the performance profiler in Chrome DevTools in this article by web.dev.
To make profiling easier, you can slow down the connection speed and CPU speed using the profiler. This allows you to experience the website as if you were using a slower device or network, giving you a better understanding of the performance outside of ideal conditions.
- CPU Throttling: 6x slow down
- Hardware Concurrency: 1
- Network: Custome Profile (down: 1000kb, up: 1000kb, latency 500ms)
React Profiler Another helpful extension for identifying problems is the React Profiler, which is part of the React Developer Tools. The React Profiler can assist in identifying specific issues related to React, such as excessive rendering.
#How to improve the INP
If you notice a high INP, it's important to investigate the cause and fix it. Some issues may be related to usability, like missing loading states, while others may be technical, like improving code execution speed. Below you find three problem fields and common pitfalls with solutions.
#Slow Running Javascript / Interaction Event Handlers
When an interaction occurs, it triggers an event handler (e.g., onClick). Since the browser can only handle one task at a time, the event handler needs to perform tasks sequentially. It's important to prioritize urgent tasks, like updating the user interface, over non-critical tasks. If the event handler prioritizes tasks incorrectly or starts tasks in an inefficient way, it can cause the event handler to take a long time and prevent the browser from painting.
More about this in the Javascript & Task Prioritization Subsection
#Slow Rendering & Too Much Rerendering
After the javascript performs its changes, React will render the necessary updates. However, in our complex application, mistakes in the component setup can cause slow rendering or excessive rerendering of components.
More about this in the Rendering Performance & React Subsection
#Slow Styling & Too Much Style Updates
After rendering, the browser needs to determine which styles to change or add and recalculate the position of affected elements. In a large and complex application like ours, mistakes in CSS or component setup can cause delays in applying style changes.
More about this in the Styling & CSS Performance Subsection
#FAQ
How do we know which component is accountable for the bad INP in the field? (technical)
React components that use next-yak have unique css classes (e.g., "ComponentName_hash") in the DOM (HTML) that are generated during build time and included in our JavaScript bundles. We use source maps to analyze the bundles and create a mapping of these css classes to the packages/files/components they come from. This allows us to track which component, page, code file, and team is responsible for the interaction.
Our Measurement vs Google Core Web Vitals (CrUX)
Google's core web vitals (also known as CrUX) have limitations in terms of what they can measure and their real-time relevance (see here ). They only capture a partial user journey and provide feedback on a monthly basis. However, interactivity is important throughout the entire user journey.
In technical terms, we have created our own system using the official web-vitals JavaScript library. This system allows us to gather more events and detailed information to track the entire user journey. We also have reporting modes that attempt to provide real-time measurements similar to Google CrUX. Both systems collect data from real users in the field.
#Sources
- web.dev - INP
- Nielsen Norman Group - Website Response Time Guidelines & 3 Important Response Limits